What is FOREX ANALYSIS?
Is the study of determining whether to buy, sell, or wait on trading a currency pair.
TYPES OF FOREX ANALYSIS
- Technical analysis
- Fundamental analysis
- Sentiment analysis
What is Technical Analysis?
Is a forex market evaluation methodology that helps traders to predict the next direction of currency pairs’ prices based on historical price movements, price action and chart patterns. According to technical traders, markets always move in repetitive patterns that can be seen and identified in trading charts. Traders who use technical analysis are known as technical traders.
Technical analysts focus on the following components
Price Action Traders use price charts, such as candle charts, which display the open, close, high and low-price levels of a particular timeframe. They use these charts to attempt to identify clues on the behavior of buyers and sellers in a short period of time.
Chart Patterns Technical analysts use drawing tools, such as horizontal lines, trend lines and Fibonacci levels, to identify well known chart patterns, such as symmetrical triangle formations and consolidation patterns. These patterns, once identified, give clarity to the strength and weakness of both buyers and sellers in the respective market.
Indicators This is where traders use technical indicators to help in understanding the market condition. For example, many indicators provide signals on when the market is overbought or oversold.
Trends Is that prices always move in trends. This means that once the current trend has started, the next price direction is more likely to continue in the same initial trend direction rather than move against it.
Price charts provide us with an amazing amount of useful data that paints a complete picture of a market’s historical and current supply and demand situation, as well as the price levels that the market participants have deemed the most important.
Time Frames
Traders can analyze price movements over different time frames, such as short-term (intraday), medium-term (daily or weekly), or long-term (monthly). The chosen time frame depends on the trader's strategy and objectives.
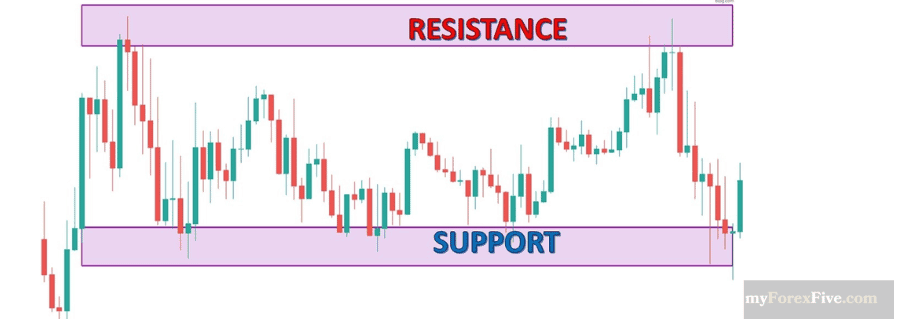
Support and Resistance
Support and resistance levels are key areas on a price chart where historical buying or selling pressure has been significant. Support is where buying interest is expected to be strong, preventing the price from falling further. Resistance is where selling interest is expected to emerge, preventing the price from rising further.
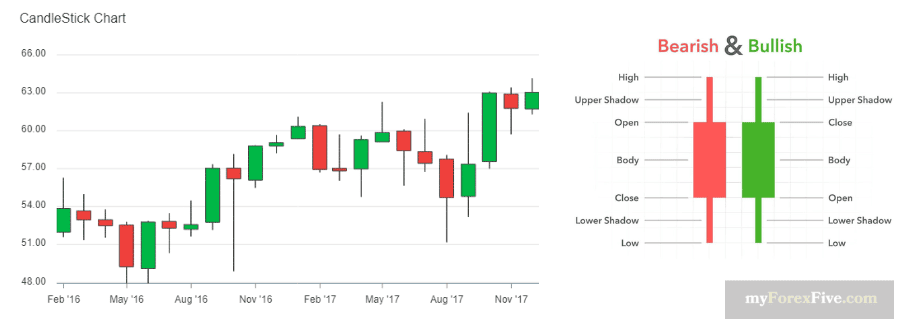
Candlestick Patterns
Candlestick charts are popular in forex technical analysis. Candlestick patterns provide visual representations of price movements and offer insights into market sentiment. Common candlestick patterns include doji, hammer, shooting star, and engulfing patterns etc.
What is forex price chart?
Price chart showing the historical price and volume data on one or more currency pairs, it is used by technical traders. Learning how to read forex charts is one of the first steps you’ll need to take if you’re looking to get into trading.
Common types of Charts
- Line Chart
- Candlestick Chart
- Bar chart
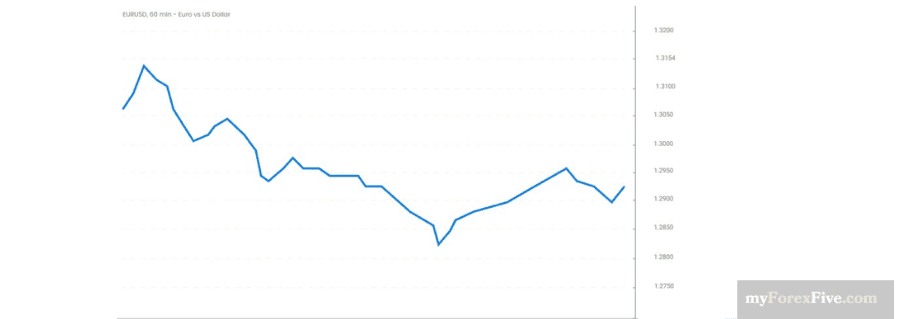
A line chart simply connects the closing prices of the timeframe you are viewing. For example, when viewing a daily chart, the line will connect the closing price of each trading day. Whether you are employing stock market or Forex technical analysis, traders mainly use line charts to identify long-term trends as it is the most basic type of chart available.
Candlestick charts were first used by Japanese rice traders in the 18th century and they are the most popular type of chart for Forex technical analysis. Candles show the open, high, low and close values of a chosen time period
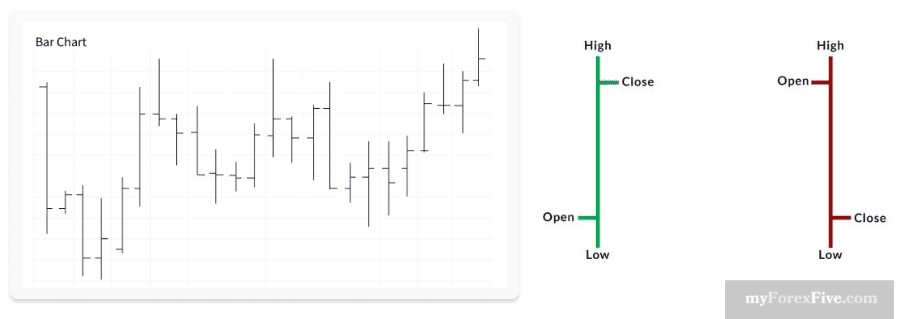
A bar chart is a type of forex chart that depicts the periodic behavior of a currency pair. In contrast to line charts, the bar chart includes four price points: the opening price (O), high (H), low (L), and closing price (C). Given this information, bar charts are often referred to as OHLC charts.
CONCEPT OF SUPPORT AND RESISTANCE
"Support and resistance” are one of the most widely used concepts in in technical analysis.
The best way to identify the target price is to identify the support and resistance points. The support and resistance (S&R) are specific price points on a chart expected to attract the maximum amount of either buying or selling.
What is SUPPORT?
Support is the price level at which demand is thought to be strong enough to prevent the price from declining further.
Support happens when there’s a fall in the forex market that results in a downward trend when lower prices increase the likelihood of traders taking a long or ‘buy’ position. Once the demand rises and becomes equivalent to the level of supply in the market, the forex price will discontinue falling.
Support is the area on the price chart that indicates traders’ willingness to buy or surplus of buyers
What is RESISTANCE?
Resistance is the price level at which selling is thought to be strong enough to prevent the price from rising further.
At Resistance level traders expect selling pressure to increase, causing the price to fall or reverse, Traders a willing to take a sell at resistance level
Resistance levels indicate where there will be a surplus of sellers.
NOTE: In this way, resistance and support are continually formed as the price moves up and down over time
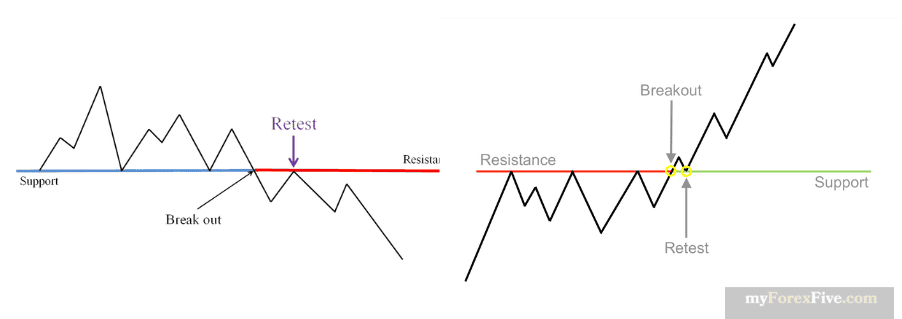
What is BREAK OUT AND RETEST?
The breakout: This is the initial movement where the price breaches a significant support or resistance level.
The retest: Following the breakout, the price retraces back to the level it previously broke through.
A breakout and retest happen when an asset makes a bullish or bearish breakout and then retests the previous resistance or support and then continues moving in the original trend
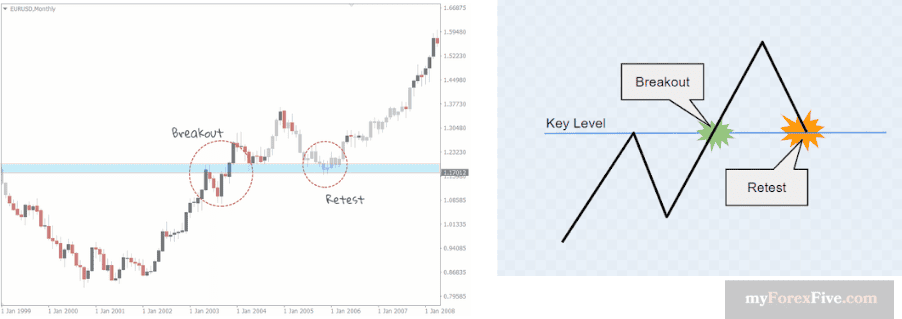
When the price passes through resistance, that resistance could potentially become support and when price break the support, that the support become resistance
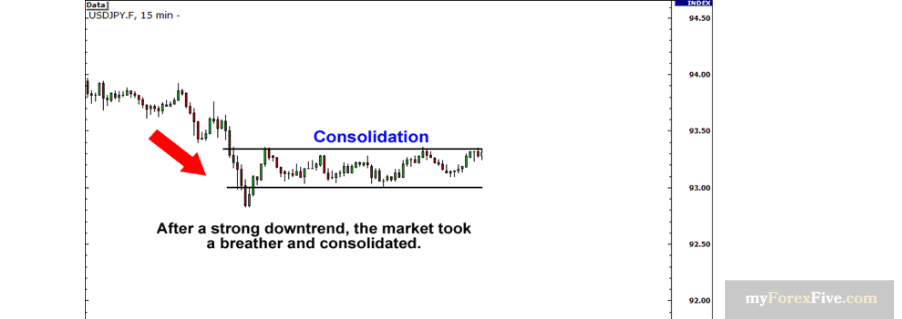
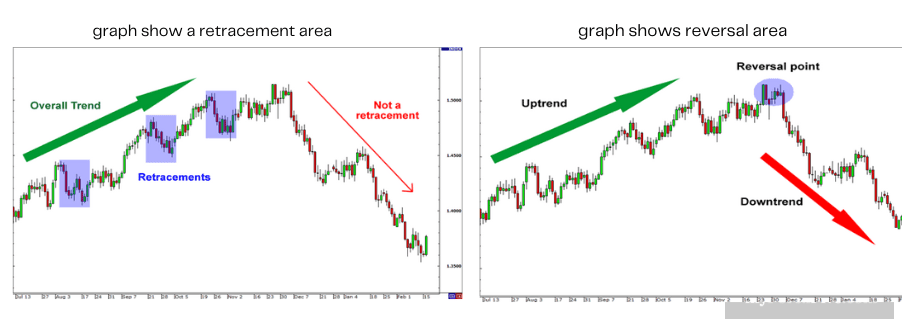
Meaning of Retracement, Consolidation and Reversal.
Consolidation refers to a period of time where the price of a currency pair moves within a defined range, without making significant progress in either direction.
A market’s price during a period of consolidation will still fluctuate, but it won’t break out of a certain price range. As soon as the market breaks out and moves either above or below the stagnant trading pattern, the period of consolidation ends.
A reversal is the end of the price trend and either the beginning of a new one or the beginning of a period of consolidation.
Retracement is any temporary reversal in price within a major price trend.
It's important to note that while technical analysis is a valuable tool for many traders, it has its limitations. Market conditions can change, and unforeseen events can impact price movements. Traders often combine technical analysis with fundamental analysis and risk management strategies for a more comprehensive approach to trading in the forex market.