Let's first have a look at what a trading strategy is.
A trading strategy refers to a systematic plan or approach that traders use to make trading decisions and manage their positions in financial markets. The primary goal of a trading strategy is to generate profits by taking advantage of market opportunities while minimizing risks.
If a trader already has a trading strategy, they might be able to use the very same one for gold and the best way to find out is to test your trading strategy in a risk-free demo environment. Demo environment you have access to virtual funds, remember that success in this environment may not be directly replicated in real-time on the live MT4 platform.
Best gold trading strategies for all traders

Trend Following Strategy: This strategy involves identifying and following the prevailing trend in gold prices. Traders may use technical analysis tools like moving averages, trendlines, and chart patterns to determine the direction of the trend (upward or downward) and enter trades in the direction of the trend.
Set stop-loss orders to limit potential losses if the trend reverses. Adjust position sizes based on the strength of the trend and overall market conditions
Breakout Trading Strategy: Traders look for significant price movements above resistance levels or below support levels. When gold breaks out of a consolidation phase, traders enter positions in the direction of the breakout, expecting the price to continue moving in that direction. Confirmation from volume indicators can strengthen breakout trading signals.
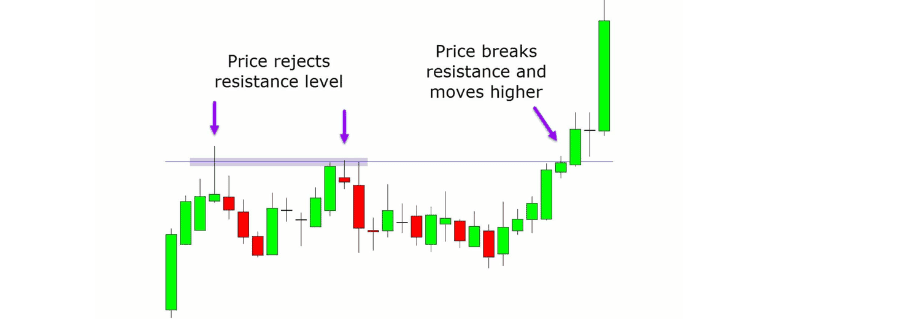
Traders may enter the positions in the market, which means they will have to closely monitor the price action, or by placing buy-stop and sell-stop orders. They will usually place the stop just below the former resistance level or above the former support level. To set their exit targets, traders may use classic support and resistance levels.
Event-Based Trading Strategy: Fundamental trading involves evaluating economic, geopolitical, and market factors that influence gold prices. Traders using this strategy analyze factors such as interest rates, inflation, central bank policies, geopolitical tensions, and macroeconomic indicators to make informed trading decisions.
Example trader can analyze the effect of inflation report release to gold price to enter gold trade. as inflation increases, the value of the currency decreases, which can make gold more attractive as a store of value. This can lead to an increase in demand for gold, which can drive up its price.
Range Trading Strategy: Range traders aim to profit from price fluctuations within a defined range. They buy near support levels and sell near resistance levels, anticipating that prices will remain within the range. Most range trading strategies are based on technical indicators that provide overbought and oversold signals, giving guidance on when market sentiment might turn. The most commonly used indicators are pivot points, oscillators, volume and volatility indicators.
Trader uses tight stop-loss orders to protect against false breakouts and monitor market conditions for signs of range expansion or contraction.
Scalping strategy: Scalping involves making multiple trades throughout the day to capture small price movements in gold. Scalpers focus on short-term price fluctuations and often use technical analysis, price action, and quick execution to profit from intraday volatility. Tight stop-loss orders are essential in scalping to manage risk.
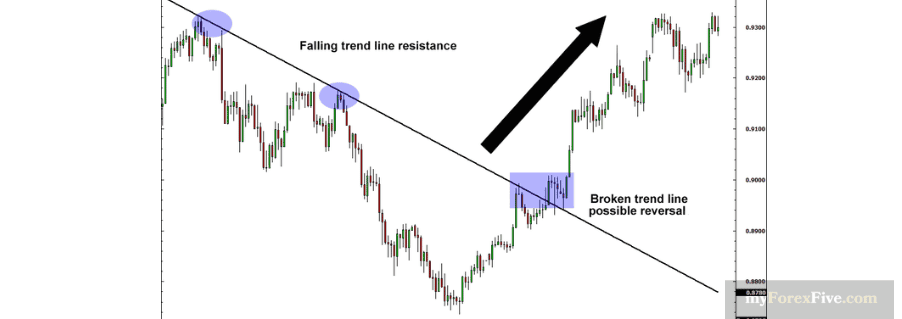
Reversal Trading Strategy: Reversal trading involves identifying potential trend reversals in gold prices. Traders look for signs of exhaustion in the current trend, such as divergence between price and momentum indicators or candlestick reversal patterns like doji, engulfing patterns, or hammer patterns. They then enter trades in anticipation of a reversal in the price direction.
How to choose the best gold trading strategy?
Choosing the best gold trading strategy depends on various factors, including your risk tolerance, investment goals, time horizon, market knowledge, and trading experience. When it comes to the strategy testing a demo account can be useful. It allows you to do back testing, but also to test your strategy in real time, while not taking any risks. You can learn about the characteristics of gold and what is driving its price in advance, but observing the price action and testing the strategy in real-time will give you a better feeling for the market.
Which gold trading session is best?
The best gold trading session depends on your trading style, preferences, and ability to monitor market developments during specific hours. It's essential to consider factors such as liquidity, volatility, economic events, and regional market influences when choosing the most suitable trading session for your gold trading activities.
Generally, Overlapping Sessions are best time to trade gold, the overlapping sessions occur during specific hours when two major sessions are open simultaneously. For example, the overlap between the European and US sessions typically occurs in the late morning to early afternoon in the Eastern Time Zone (ET). Overlapping sessions tend to have increased trading activity, liquidity, and volatility as traders from both regions are active in the market and major market-moving events and economic releases may occur during these hours.
Best indicators for gold trading

When trading gold, traders often use a combination of technical indicators, chart patterns, and fundamental analysis to make informed trading decisions.
Here are some of the best indicators commonly used in gold trading:
- Moving Averages
Simple Moving Average (SMA) and Exponential Moving Average (EMA) These indicators smooth out price data over a specified period, helping traders identify trends and potential reversal points. Common periods used for moving averages in gold trading include 50-day, 100-day, and 200-day.
- Relative Strength Index (RSI)
RSI measures the strength of price movements and helps identify overbought or oversold conditions. Traders use RSI to gauge potential trend reversals or continuation signals in gold prices.
- Bollinger Bands
Bollinger Bands consist of a moving average (typically 20-day SMA) and upper and lower bands that represent standard deviations from the moving average. Traders use Bollinger Bands to identify volatility and potential price breakouts or reversals in gold prices.
- MACD (Moving Average Convergence Divergence)
MACD is a trend-following momentum indicator that helps traders identify changes in momentum and potential trend reversals. Traders look for bullish or bearish crossovers, divergence with price, and histogram patterns for trading signals.
- Fibonacci Retracement Levels
Fibonacci retracement levels are based on key Fibonacci ratios (e.g., 38.2%, 50%, 61.8%) and are used to identify potential support and resistance levels in gold prices. Traders use Fibonacci retracement levels to determine entry and exit points based on price corrections within a trend.
- Volume Indicator
Volume indicators, such as Volume Bars or On-Balance Volume (OBV), provide insights into trading activity and help confirm price movements. Increasing volume during price advances or declines can validate the strength of trends or potential reversals.
It's important to note that no single indicator can guarantee successful trading outcomes. Traders often use a combination of indicators, confirmatory signals, risk management techniques, and market analysis to build effective trading strategies in gold markets. Additionally, traders should adapt their strategies based on changing market conditions, news events, and economic data releases impacting gold prices.