CANDLESTICK
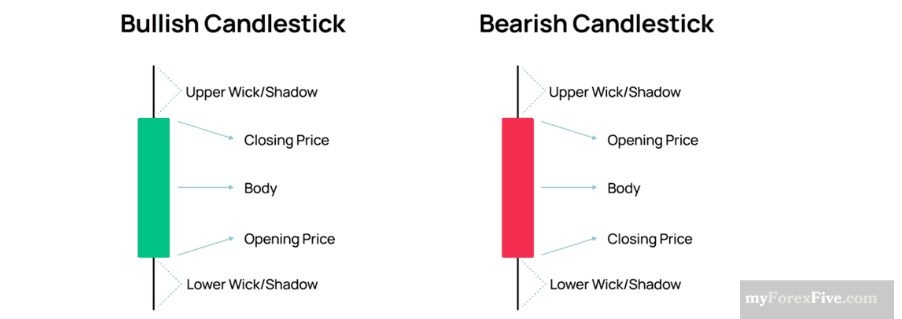
Candlestick Meaning: is a single bar which represents the price movement of a particular asset for a specific time period. The information it displays includes the open, high, low and close for that time period.
The body, which represents the open-to-close range
The wick, or shadow, that indicates the intra-day high and low
The color, which reveals the direction of market movement – a green (or white) body indicates a price increase(buy), while a red (or black) body shows a price decrease(sell)
Candlestick charts are one of the most popular components of technical analysis, enabling traders to interpret price information quickly and from just a few price bars.
Candlestick patterns take into account one or more candlesticks to assist technical traders in developing inferences about future movements and price movement of the underlying asset. In order to recognize and apply the most commonly used candlestick patterns to a trading strategy, traders need to understand how the inclination of these patterns can affect the market direction.
Candlestick patterns have long been recognized as a powerful tool in the world of financial markets. First used in Japan in the early 16th Century, candlestick charts provide valuable insights into market sentiment and price movement dynamics.
Bullish and Bearish Candlestick Patterns
Bullish Candlestick Pattern It indicates a higher probability of upward price movement. It typically suggests that buyers are in control, driving prices even higher. Bullish patterns often exhibit characteristics such as larger green bodies, long lower shadows, and short upper shadows. These patterns can signify a potential trend reversal, continuation of an existing uptrend, or the formation of a support level.
Bearish Candlestick Pattern is a potential sell sign and traders generally take short positions after the formation of the bearish pattern. When bearish pattern is formed it indicates the sellers will overpower the buyers and would drag the price down, trend reversal or continuation of existing trend.
TYPES OF CANDLESTIC PATTERN
- Reversal candlestick pattern
- Continuation candlestick pattern
- Neutral candlestick pattern
REVERSAL CANDLESTIC PATTERN
Reversal Candlestick Pattern It indicate a potential change in the direction of the trend rather than its continuation typically characterized by the market moving higher or lower after the momentum in the previous direction has been exhausted.
Reversal candlestick patterns are formed by a single or group of candlesticks that denote a shift in market sentiment. Bullish reversals point to a potential shift from a downward trend to an upward trend, while bearish candlestick reversal patterns indicate a potential shift from an upward trend to a downtrend.
There are many reversal patterns, but some are more frequently used than others.
We look at common reversal candlestick pattern to be aware of
- Shooting Star
- Evening Star
- Morning Star
- Bullish Engulfing
- Bearish Engulfing
- Hammer (Pin Bar)
- Long Wick
- Bullish Harami
- Bearish Harami
- Piercing pattern
- Dark Cloud Cover
- Three white Soldiers
- Three Black Cows
- The Three Outside Up
- The Three Outside Down
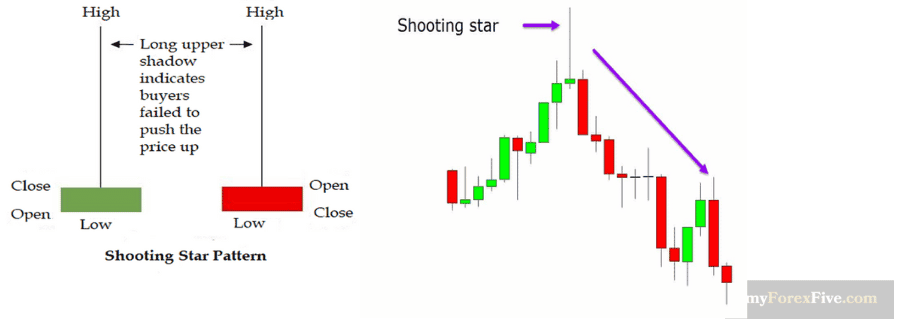
Shooting Star is a bearish candlestick with a long upper shadow and it is found at the top of an uptrend indicating a potential downside reversal. Shooting star candle must be formed while the market is rising. The shape of the shooting star reflects the fact that, while buying pressure has lifted the price, the momentum has slowed, and selling activity has pushed the closing price down. This is a bearish signal to traders as it suggests the upward trend could be ending, and a downward trend could be starting.
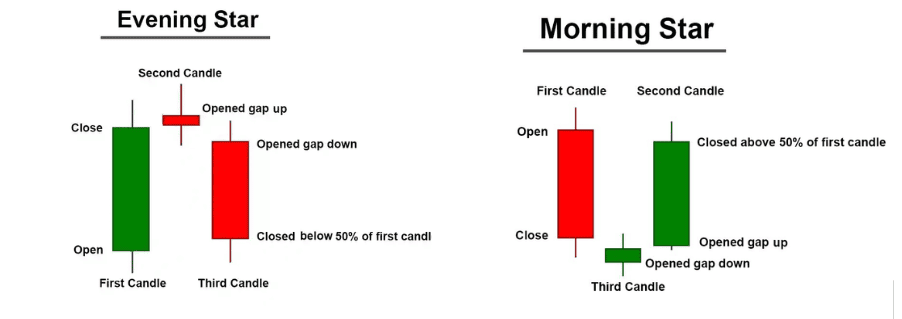
Evening star is a three-candlestick pattern that is the equivalent of the bullish morning star. It is formed of a short candle sandwiched between a long green candle and a large red candlestick. It indicates the reversal of an uptrend, and is particularly strong when the third candlestick erases the gains of the first candle.
Morning Star is a powerful signal that denotes a reversal of a downtrend, indicating that the market is about to see a new day with a sunrise of higher prices. This pattern consists of three candles, with the first being an extended red candle indicating that the bears are in control. The second candle is a small real body that does not touch the prior real body, suggesting that the sellers are losing strength to drive the market down. The final candle has a green real body that invades deeply into the first red candle, signaling that the bulls are back in control.
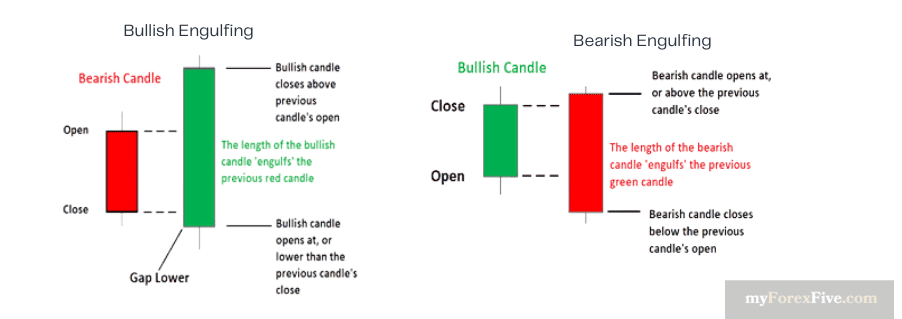
Bullish Engulfing is formed of two candlesticks the first candle is a short red body that is completely engulfed by a larger green candle. Bullish engulfing pattern confirms a trend reversal, the price does not typically fall any further than the low of the second candlestick. Therefore, traders often use it to enter a trade at the market opening price after the second candle has closed and place a stop loss underneath the second candle’s low.
Bearish Engulfing is formed when a green candlestick is followed by a larger red candlestick. The exact opposite of a bullish engulfing pattern. The green candlestick must completely cover the previous candlestick. The pattern suggests that the bears have taken charge of the market and indicate a possible decline in price in the near future, so traders look for selling opportunities.
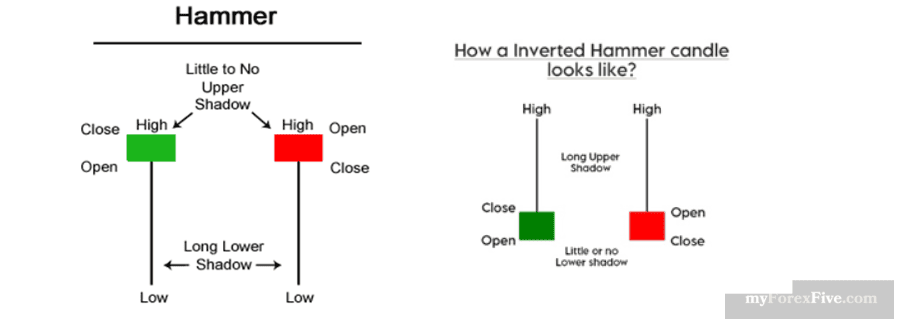
Hammer (Pin Bar) is viewed as a bullish reversal usually occurring at the bottom of a downward trend. This candle formation includes a small body whereby the open, high, low and close are roughly the same. There is a long lower wick beneath the body which should be more than twice the length of the candle body. The body may be bullish or bearish, however bullish is considered more favorable. Traders typically buy when the reversal is confirmed by subsequent candles and place a stop loss below the bottom of the hammer or possibly just below the candle’s body if the price moves aggressively higher in the confirmation candle.
Inverted Hammer is a one-candlestick formation that can signal a potential reversal from a downtrend to an uptrend in the market. It is made up of a candle with a small lower body, little or no lower wick, and a long upper wick that is at least two times the size of the lower body. Traders and technical analysts often look for this pattern to identify potential buying opportunities in financial markets. Shooting Star looks exactly the same as the Inverted hammer, but instead of being found in a downtrend it is found in an uptrend and thus has different implications.
Different between Hammer vs Inverted Hammer
The hammer and inverted hammer are both candlestick patterns that are used to identify potential trend reversals in technical analysis. The hammer occurs during a downtrend and has a small body at the upper end of the trading range with a long lower shadow. It suggests a potential shift in market sentiment from sellers to buyers.
The upside-down green hammer or the red inverted hammer candlestick also occurs during a downtrend and consists of a single bar with a small body at the bottom and a long upper shadow. It states that buyers are taking control.
Both patterns indicate bullish reversals but have slight differences in their candlestick formations.
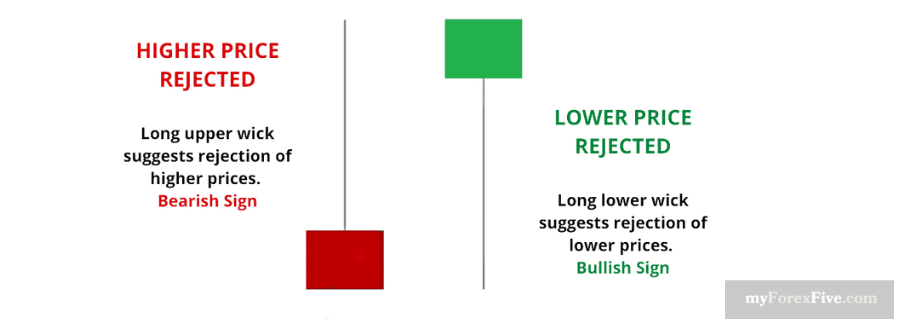
Long Wick Is a reversal signal which tends to resolve in the opposite direction of the current prevailing trend. It is one of the most iconic candlestick types, receiving its name due to its long wick attached to the candle body. The green color of the candle’s body means that the closing price is more than the opening price. The red candle signifies the opposite where the opening price is more than the closing price. However, as a reversal signal, the color of the candle does not hold any significance. Instead, the candle’s location plays a significant role in determining whether the candlestick represents a potential bullish or bearish reversal.
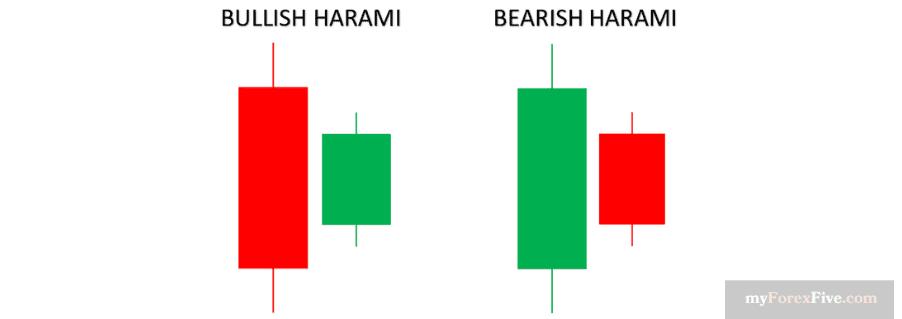
Bullish Harami The word “Harami” in Japanese means “pregnant.” The term represents the pattern’s appearance, which resembles a pregnant woman’s body with a small candlestick “inside it.” Bullish Harami the first candlestick is red, and the second one is green—a good time to look for buying opportunities or trend reversal in bear trend.
Bearish Harami The pattern will have the first candlestick green and the second candlestick red and indicates a possible trend reversal a good time trader to take a selling opportunity.
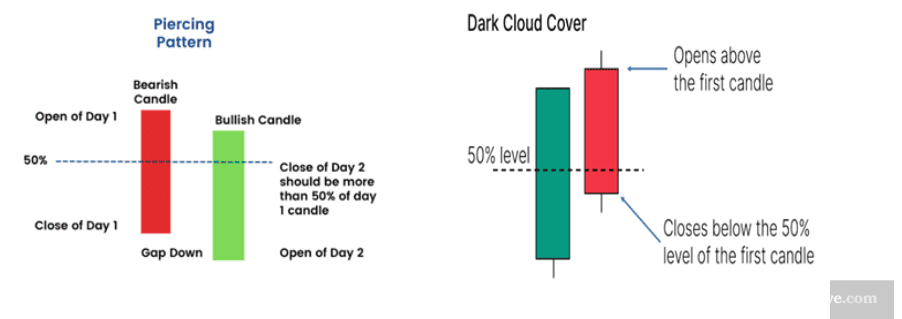
Piercing Pattern It indicates a bullish candlestick reversal pattern formed at the end of a downtrend or during a pullback within an uptrend, or at the support level. It is formed when a long falling candlestick is followed by a long rising candle, which opens lower than the preceding candle but closes above its midpoint.
The length of the candles and the gap between them indicates how powerful the trend reversal will be: the longer the second candle, the stronger the signal; if there is a gap up after the second candle, the trend is stronger.
Traders usually wait for the price to form another bullish candle after the piercing line formation. If it’s bullish, they go long. A stop-loss order is usually placed below the pattern’s second candle.
Dark Cloud Cover is a bearish reversal pattern formed by a long rising candle followed by a long falling candle that opens higher than the prior one but closes below its midpoint. The Dark Cloud Cover pattern looks similar to that of the Bearish Engulfing pattern. The difference between the two relates to the second candlestick. Bearish Engulfing pattern has the second candlestick opening above the close of the first, while the Dark Cloud Cover opens above the high of the first candle and closes below the midpoint of the first candlestick body.
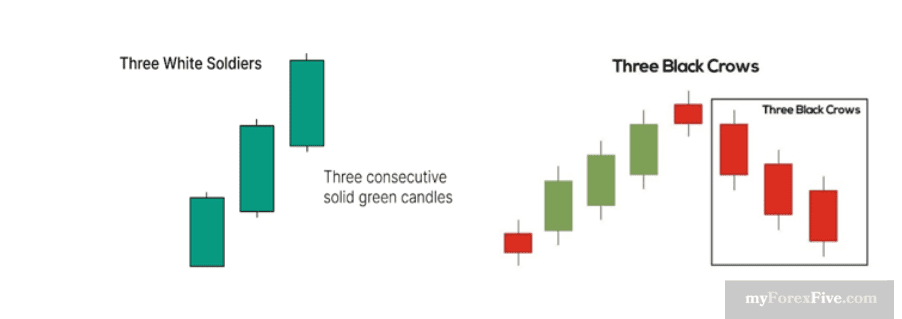
Three White Soldiers is a bullish reversal pattern consisting of three green candlesticks with small shadows. This pattern is more reliable when it forms in a downtrend that has been developing for a longer period of time. It consists of three consecutive long-bodied candlesticks that open within the previous candle's real body and a close that exceeds the previous candle's high. Traders who are short on the security look to exit and traders who are waiting to take up a bullish position see the three white soldiers as an entry opportunity.
Three Black Crows Is a bearish reversal pattern that is more accurate when it forms at the end of an uptrend. This pattern is formed by three consecutive bearish candlesticks. The opening of each candlestick occurs at the previous candlestick’s closing price, and the closing price is lower than the opening price. The three black crows’ pattern is particularly significant when it occurs at higher price levels or after a mature advance, indicating a potential decline in prices.
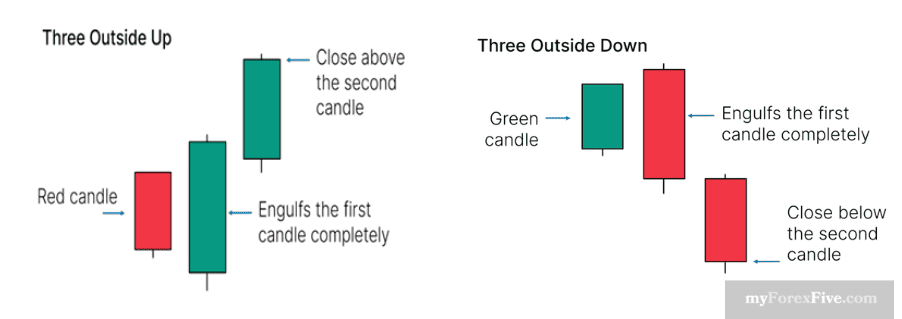
The Three Outside Up Is a variation of the chart candle reversal pattern that is used to indicate a trend reversal. The three outside up pattern forms at the downtrend and it takes three days for the pattern to form. The three outside up candlestick pattern comprises three consecutive candles forming the patterns most preferably at the end of the downtrend.
Three Outside Down Is a bearish reversal setup formed by a small green candlestick, a large red candle that engulfs the previous one, and a red candle that closes below the close of the second one. Traders take this as a signal to sell below the wick of the third candle, placing a stop loss at the peak of the second wick.
Continue learning next chapter below