CHART PATTERN
What is chart pattern? Are specific price formations on a chart that predict future price movements. As technical analysis is based on the assumption that history repeats itself, popular chart patterns have shown that a specific price movement is following a particular formation of price pattern with high probability.
There are four key elements that are needed for formation of pattern
Breakout point: The breakout point is the point at which the instrument’s price breaks out of the support or resistance level. The breakout can occur at a horizontal level or a diagonal level, depending on the price action.
New trend: The new trend is the reversal of the old trend that the instrument’s price becomes when it exists out of the trendline area.
Old trend: Is the trend that the instrument price is in as the new pattern begins to form.
Consolidation zone: The consolidation zone is the constricted area recognized by the support and resistance levels.
Types of chart pattern
- Reversal Chart Pattern
- Continuation Chart Pattern
- Bilateral Chart Pattern
Reversal Chart Pattern
Are chart formations that indicate a change in the direction of the price trend and they can signal the end of an uptrend or a downtrend, and the start of a new move in the opposite direction. Reversal chart patterns can help you identify and trade potential price reversals and its formations reflect the shift in the balance of power between buyers and sellers.
Common Reversal Chart Patterns Are:-
- Double Top
- Triple Top
- Double Bottom
- Triple Bottom
- Head and Shoulders
- Inverse Head and Shoulders
- Rising Wedge
- Falling Wedge
- Triple Top
- Triple Bottom
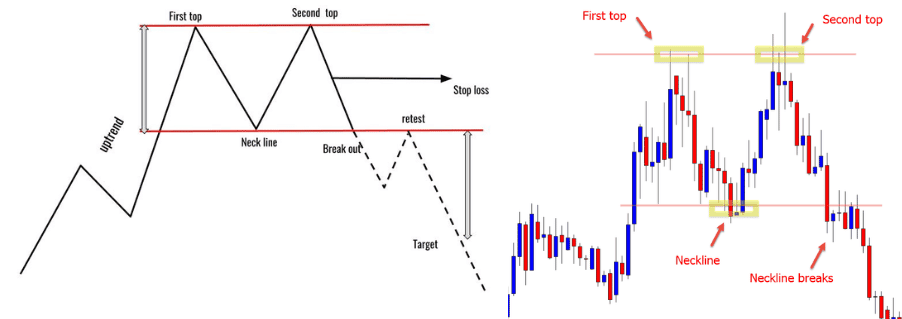
Double Top is a chart pattern where the price reaches a high twice and fails to break out higher during the second attempt. The pattern is completed when the price breaks below the support level and considered a bearish reversal chart pattern. Double Tops appear in an uptrend and reverse it to the downside as price breaks through the support line (Neckline)
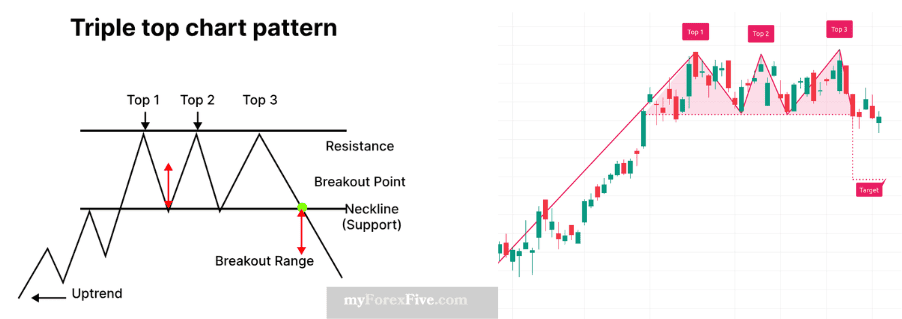
Triple Top Is a charting pattern used in technical analysis that signals a potential bearish reversal. It consists of three similar price highs with price pullbacks between the peaks which resembles the shape of the letter M. When triple top formation occurs, it implies an asset may have concluded a recent rally and is likely to reverse course and begin to fall more substantially than previous legs.
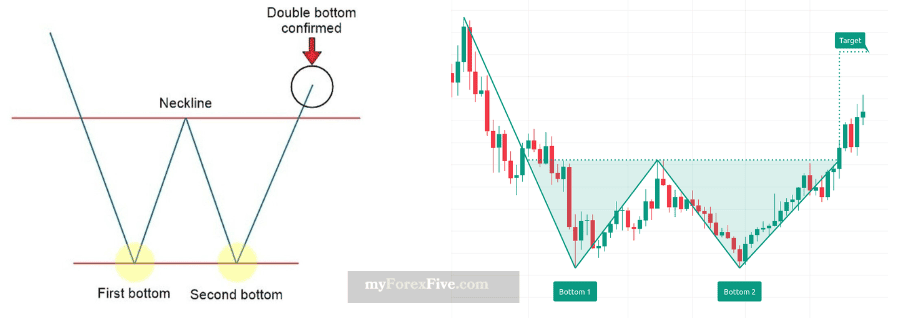
Double Bottom is a chart pattern where the price holds a low two times and fails to break down lower during the second attempt, and instead continues higher. It is considered a bullish reversal chart pattern since the price holds a low two times and eventually continues with a higher high.
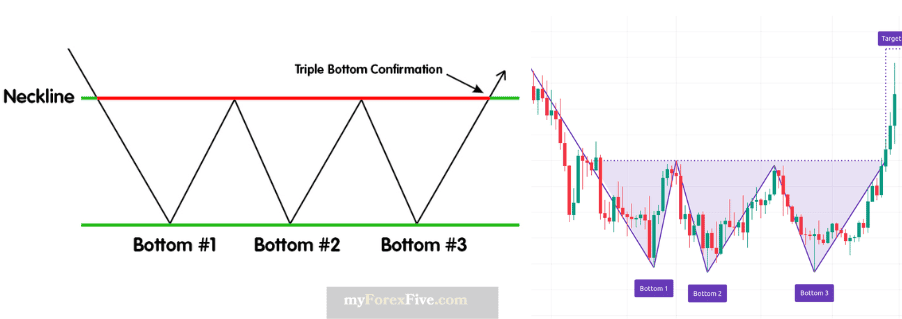
Triple Bottom Is a bullish reversal chart pattern that is formed at the end of a downtrend. It consists of three distinct lows that are roughly equal in price and separated by two intermediate highs. This forms the distinctive W-shape of the pattern. The triple bottom pattern is best suited to swing trading, as the months-long formation of the pattern signals that the bears have run out of steam.
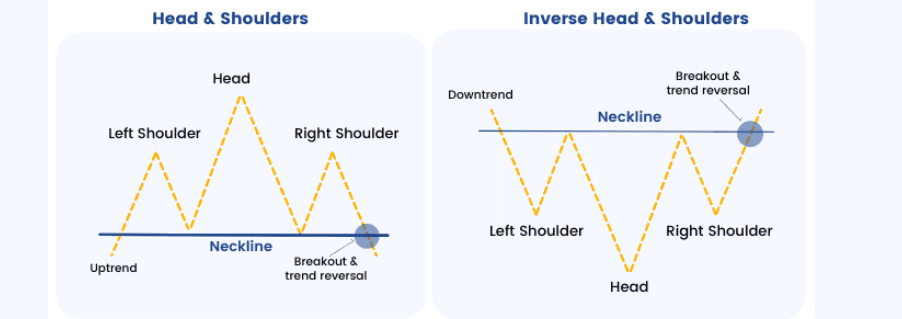
Head and Shoulder It consists of three peaks, with the middle one (the head) being higher than the other two (the shoulders). The pattern is completed when the price breaks below the neckline, which is a horizontal line that connects the lows of the two shoulders. The head and shoulders indicate a reversal from an uptrend to a downtrend. The Head and Shoulders chart pattern is considered by many traders and analysts to be one of the most reliable and accurate of all reversal chart patterns.
Inverse Head and Shoulder is a technical chart pattern that signals a potential trend reversal from a downward trend to an upward trend in the price of a security or asset. The pattern resembles the shape of a person’s head and two shoulders in an inverted position, with three consistent lows and peaks. The chart aims to identify a potential reversal in a downtrend, indicating a possible bullish trend.
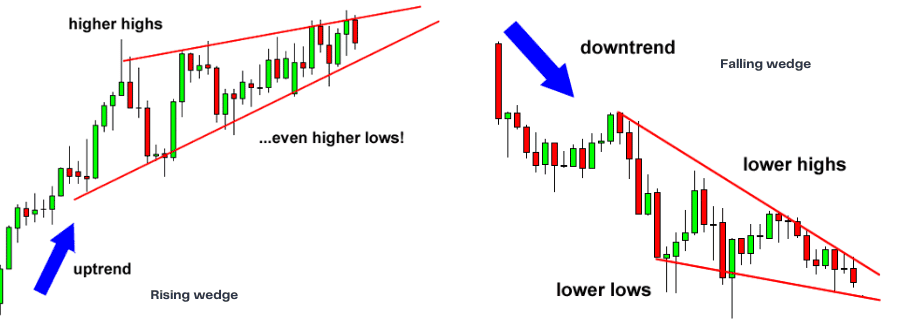
Rising Wedge is a chart pattern formed by drawing two ascending trend lines, one representing highs and one representing lows and it is categorized as a bearish reversal chart pattern. The rising wedge can be one of the most difficult chart patterns to accurately recognize and trade. While it is a consolidation formation, the loss of upside momentum on each successive high gives the pattern its bearish bias. However, the series of higher highs and higher lows keeps the trend inherently bullish. While though this article will focus on the rising wedge as a reversal pattern, the pattern can also fit into the continuation category.
Falling Wedge is a bullish chart pattern that can indicate a potential continuation of an uptrend or a reversal of a downtrend. It is formed by a series of lower highs and higher lows, indicating a weakening downtrend and potential bullish sentiment.
Continue learning next chapter below